Firsthand Technology Opportunities Fund
| Average Annual Total Returns vs. Indices | |||
|---|---|---|---|
| As of MARCH 31, 2024 | |||
| Period | Firsthand Technology Opportunities Fund |
NASDAQ Composite Index | S&P 500 Index |
| Since inception (9/30/99) | 1.01% | 8.59% | 7.93% |
| 10-Year | 3.89% | 15.73% | 12.96% |
| 5-Year | -9.49% | 17.19% | 15.05% |
| 3-Year | -31.17% | 8.17% | 11.49% |
| 1-Year | -16.74% | 35.08% | 29.88% |
| Q1 '24 (not annualized) | -16.46% | 9.31% | 10.56% |
The Fund's performance information assumes reinvestment of all dividends and includes all Fund expenses, but does not reflect the impact of taxes. Performance data quoted represent past performance, which is not a guarantee of future results, and current performance may be lower or higher than the performance quoted. Both the return from and the principal value of an investment in the Fund will fluctuate so that any investor's shares, when redeemed, may be worth more or less than their original cost. To obtain performance as of the most recent month-end, please contact Firsthand Funds by calling 1.888.884.2675 or go to www.firsthandfunds.com.
The Fund's total gross operating expenses are 1.86%. The Fund's total net operating expenses are 1.85%. Under the Investment Advisory Agreements, the Investment Adviser has agreed to reduce its fees and/or make expense reimbursements so that the Fund's total operating expenses (excluding independent trustees' compensation, brokerage and commission expenses, litigation costs and any extraordinary and non-recurring expenses) are limited to 1.85% of the Fund's average daily net assets up to $200 million, 1.80% of such assets from $200 million to $500 million, 1.75% of such assets from $500 million to $1 billion, and 1.70% of such assets in excess of $1 billion. The current expense waiver is in effect until 4/30/24.
Growth of a Hypothetical $10,000 Investment
September 30, 1999 through March 31, 2024
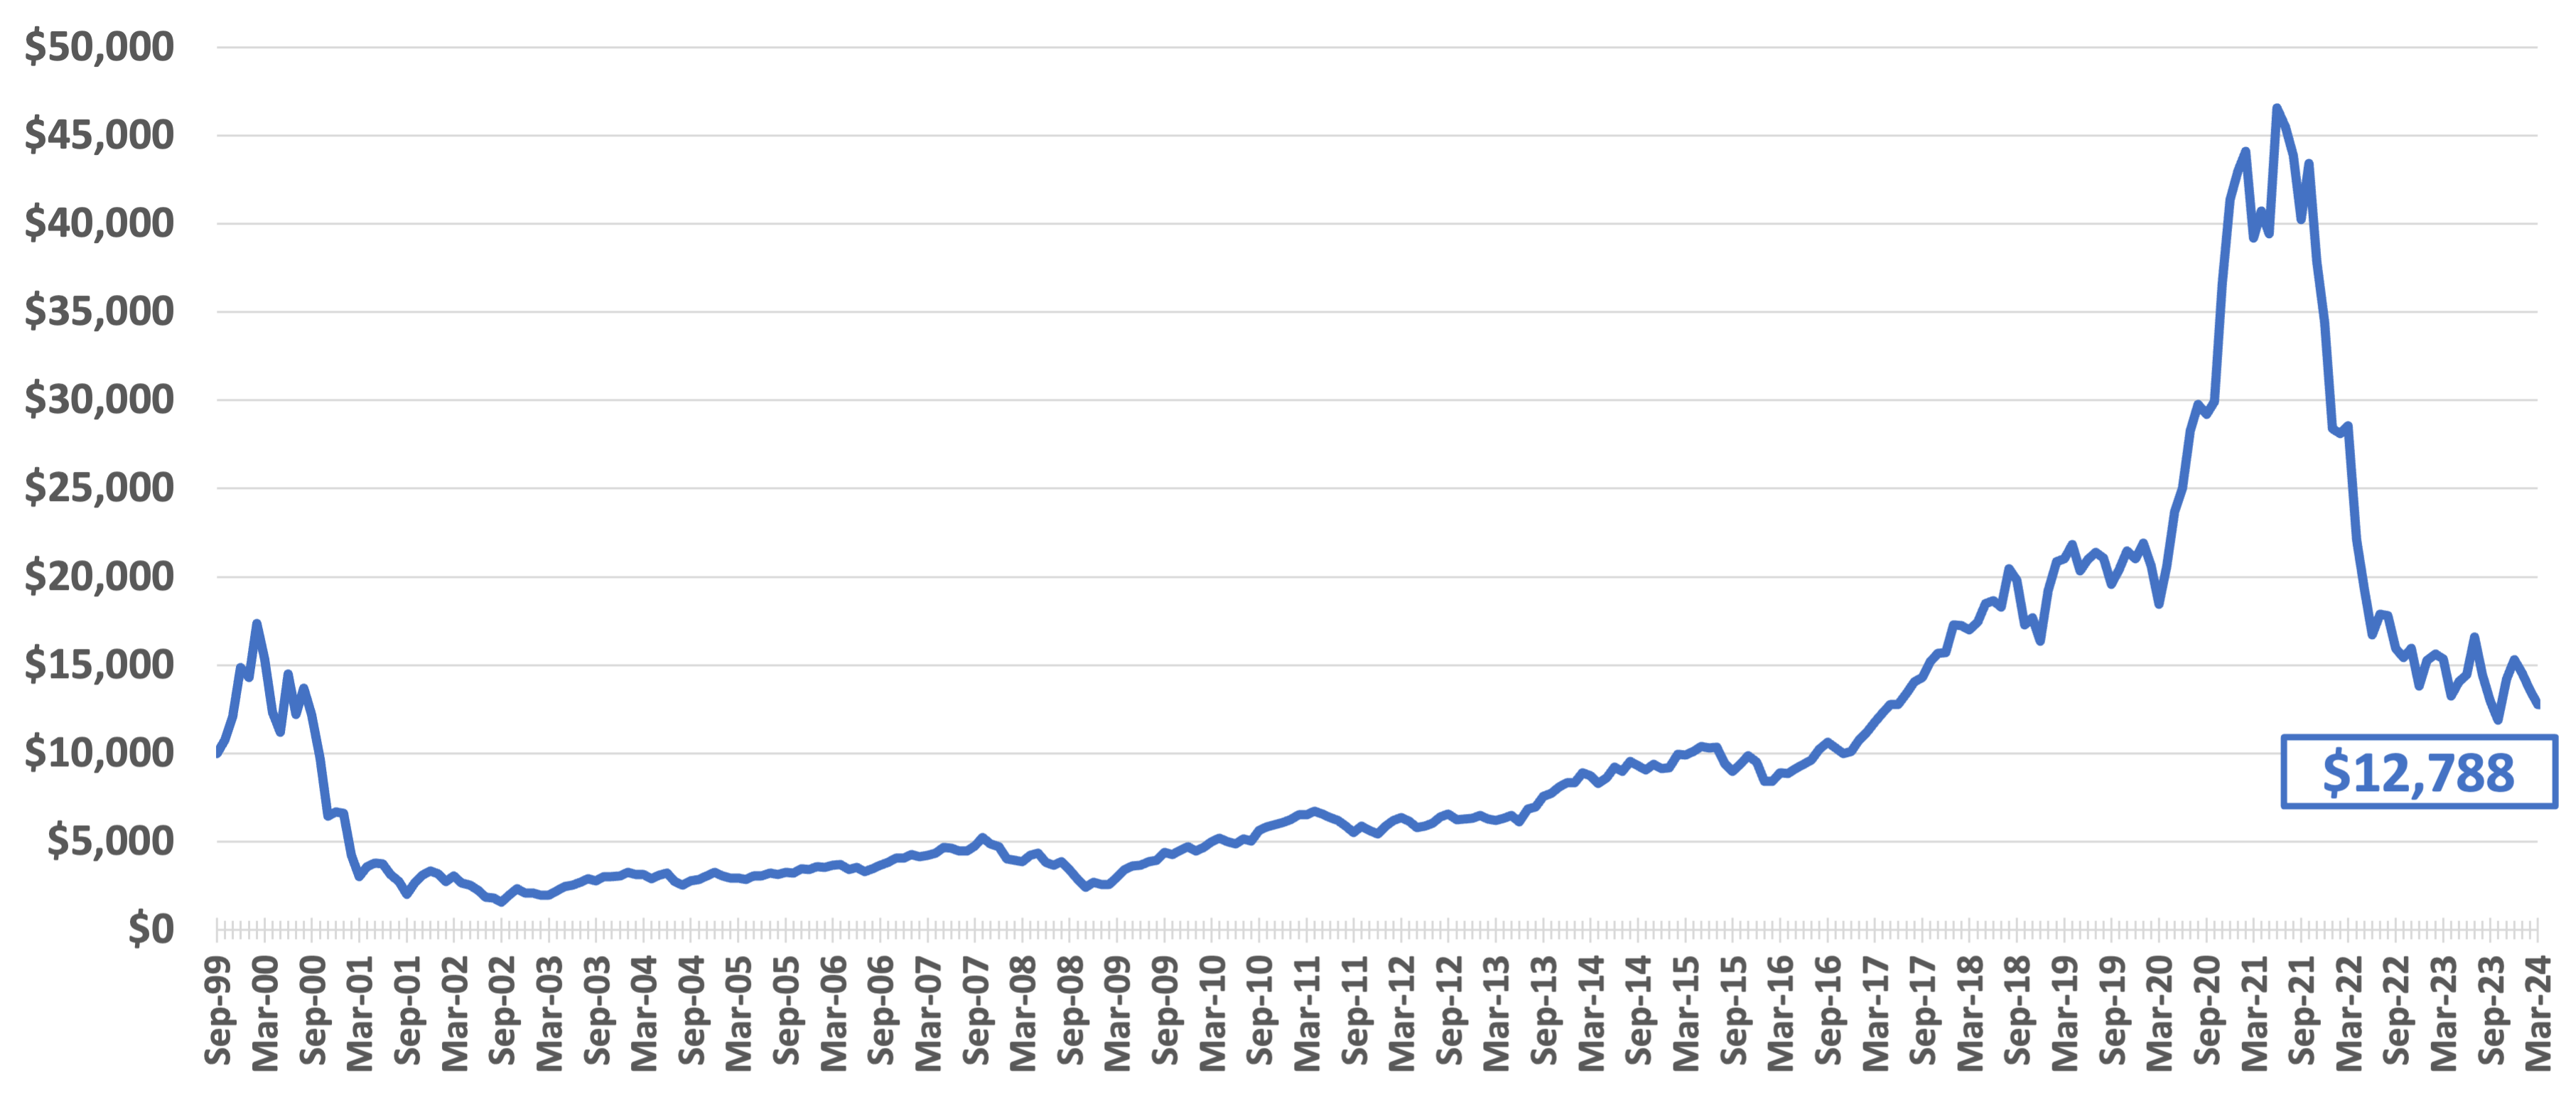
Chart represents the growth of a hypothetical $10,000 investment from Firsthand Technology Opportunities Fund inception date until the end of the quarter indicated. Firsthand Technology Opportunities Fund performance assumes reinvestment of all dividends and includes all Firsthand Technology Opportunities Fund expenses but does not reflect the impact of taxes.
Q4'23 Contributors to Performance
Streaming media leader Roku (ROKU) was the biggest contributor to the Fund’s performance in Q4. The company’s stock was up nearly 30% in the fourth quarter, on the heels its late-October earnings announcement that exceeded expectations.
Kratos Defense & Security Solutions (KTOS) was the second most significant positive contributor to fund performance in Q4. Kratos shares leaped higher in early October, as investor sentiment improved with the outbreak of the Israel-Hamas war. The stock continued its ascent following better than expected earnings results in early November.
The third largest contributor to the Fund’s performance in Q4 was Palo Alto Networks (PANW). The cybersecurity company’s stock rose 25% increase in Q4 after posting 20% revenue growth in its fiscal first quarter ended October 31, 2023. In December, the company completed the acquisitions of two cybersecurity start-ups: Talon Cyber Security and Dig Security.
Q4'23 Detractors from Performance
The largest detractor from the Fund’s performance in Q4 was Bill Holdings (BILL), a financial automation software supplier to small and midsize companies. Bill Holdings’ stock feel sharply in early November after the firm announced revenue guidance for its full fiscal year that fell short of analysts’ expectations.
Solar micro inverter company SolarEdge (SEDG) was the second largest detractor from the Fund’s performance during the quarter. The company’s stock plunged during Q4 after its financial results and revenue outlook disappointed investors. SolarEdge pointed to softening customer demand, particularly in Europe, for its poor performance.
After buying shares in Nano Dimension (NNDM) earlier in the year, we sold our position at a loss in December. Prior to our liquidating the shares, the supplier of equipment used in the additive manufacturing (think 3D printing) of electronic components was the third largest drag on performance in Q4.
Firsthand Technology Opportunities Fund is subject to greater risk than more diversified funds because of its investments in fewer securities and because of its concentration of investments in certain industries in the technology sector. Specific risks associated with investments in the technology industries (as described in the Fund's Prospectus) could cause the Fund's share price to fluctuate dramatically. The Fund's investments in small-cap companies present greater risk than investments in larger companies. The Fund invests in several industries within the technology sector and the relative weightings of these industries in the Fund's portfolio may change at any time. Equity investing involves risks, including the potential loss of the principal amount invested.
The NASDAQ Composite Index (NASDAQ) and the Standard & Poor's 500 Index (S&P 500) each represent an unmanaged, broad-based basket of stocks and are typically used as benchmarks for overall market performance. The indices' performance figures assume the reinvestment of all dividends (except where noted), but do not reflect the impact of taxes. Additionally, because an investor cannot invest in an index directly, indices' performance figures do not reflect the expenses associated with the management of an actual mutual fund portfolio.
As of 12/31/23: ROKU (10.1% of TEFQX), KTOS (7.3% of TEFQX), PANW (2.0% of TEFQX), BILL (3.4% of TEFQX), SEDG (1.3% of TEFQX), NNDM (0.0% of TEFQX). A complete list of portfolio holdings for Firsthand Funds is available on www.firsthandfunds.com and is updated 45 days after the end of every calendar quarter. The portfolio holdings discussed are subject to change.
The information provided should not be considered a recommendation to purchase or sell a particular security and there is no assurance that, as of the date of publication, the securities purchased remain in a Fund's portfolio or that securities sold have not been repurchased. Also, you should note that the securities discussed, even if they have been purchased by a Fund, do not represent a Fund's entire portfolio and, in the aggregate, may represent only a small percentage of that Fund's holdings. There can be no assurance that any Firsthand Funds will buy, sell, or hold any particular security after the date referred to in the discussion.